Mailing Address: PO Box 6263 Hendersonville, NC 28793
Physical Address: 311 White St Hendersonville, NC 28739
Radon Resources
Radon Risks by County
The USEPA has published county-by-county maps of radon risk assessments. The color-coded maps represent the expected radon test result if any single property within the county were tested. It is important to realize that any particular structure may test higher or lower than the expected result for the county.
- RED...........high risk.............> 4.0 pCi/L
- ORANGE...moderate risk...2.0-3.9 pCi/L
- YELLOW.........low risk.........., 2.0 pCi/L


Radon in the News
- Radon's role in lung cancer (G.R.A.C.E.)
- Developer sued over radon
- Health physics society position on radon
- Scientists and investigators cite need for radon regulation to prevent lung cancer- call current EPA efforts ineffective
- Stochastic aspects of primary cellular consequences of radon inhalation
- Program to identify likely victims of radon-related lung cancer; survivors commit to risk reduction despite failed government policy
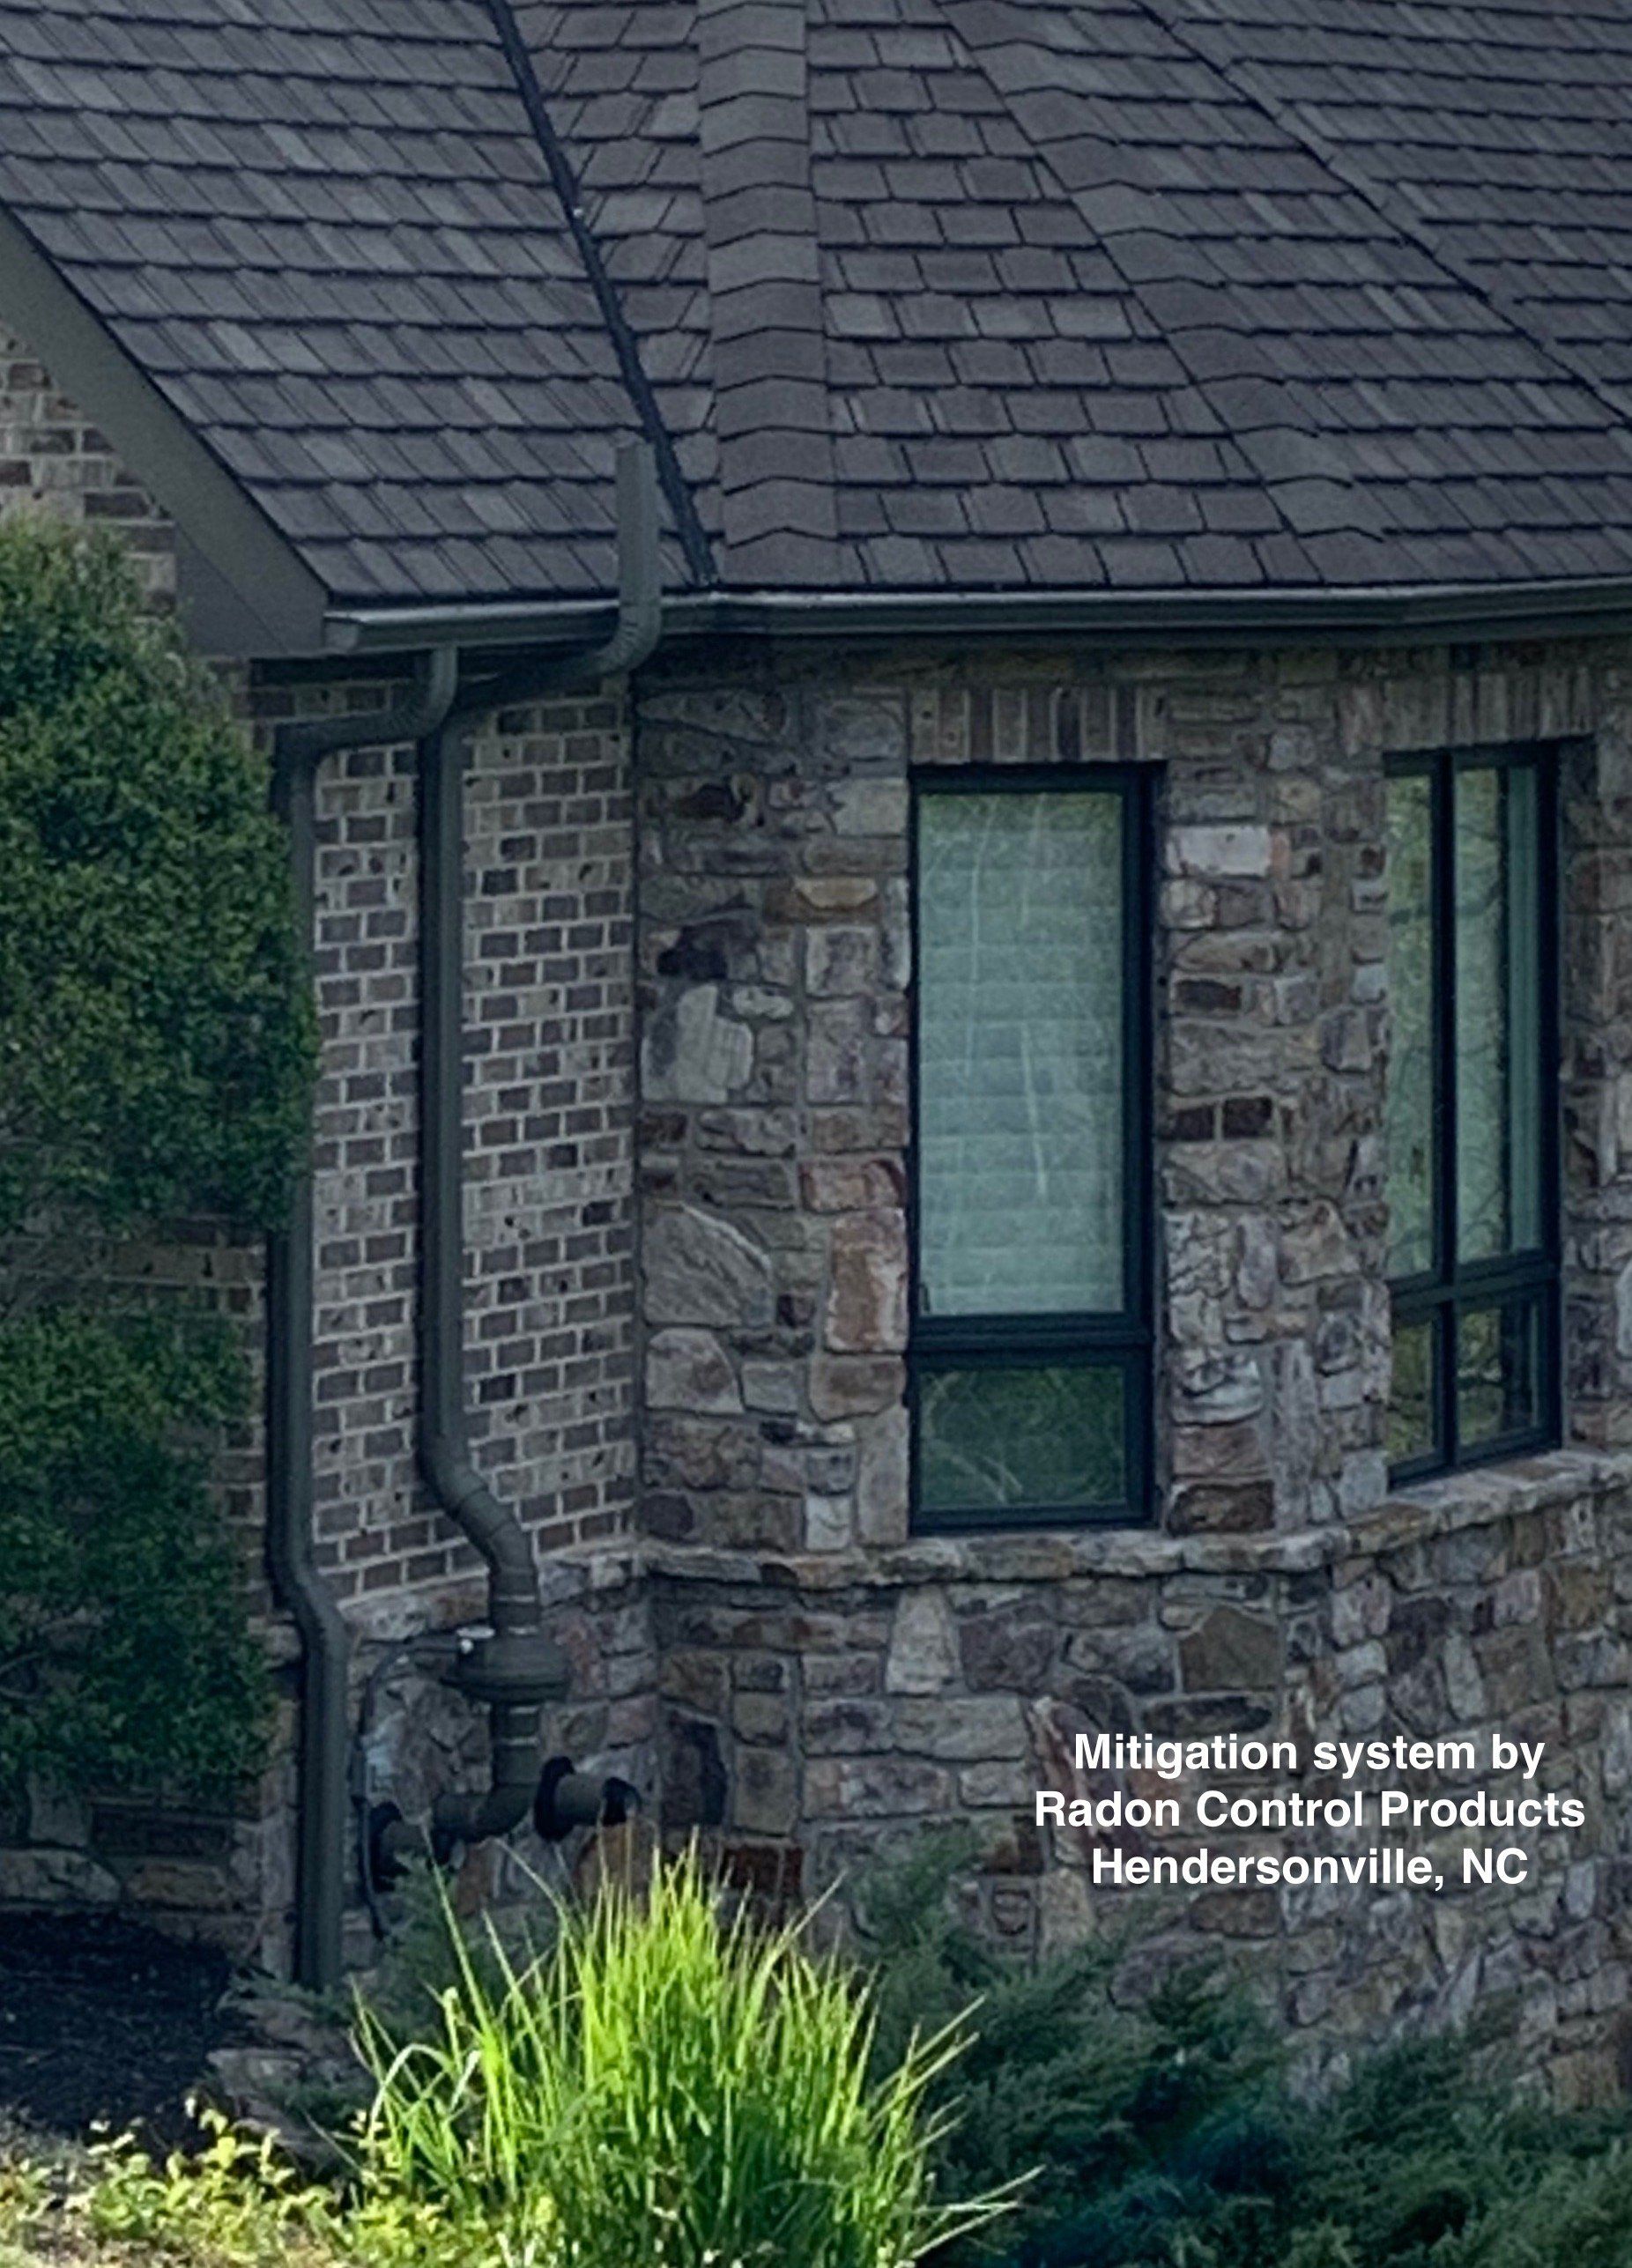
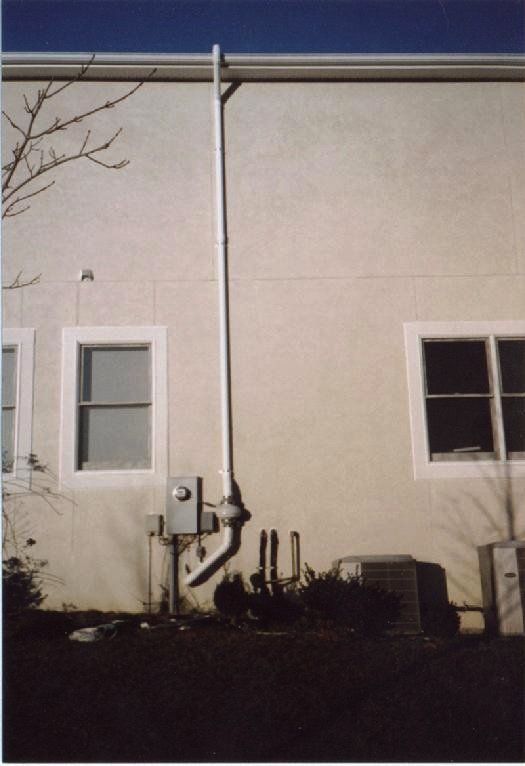
Want to learn more? Speak with the experts at Radon Control Products for more information!
CONTACT INFORMATION
Phone: (828) 698-4960
Email: radoncontrol@cs.com
Mailing Address : PO Box 6263 Hendersonville, NC 28793
Physical Address: 311 White St Hendersonville, NC 28739
Business Hours
- Mon - Fri
- -
- Sat - Sun
- Closed


OUR LOCATION